Grafana is an open source data visualization tool. It is the a popular choice with Kubernetes clusters.
Azure Managed Grafana is a platform as a service offering that has been generally available in late summer or early fall. So it is relatively new at this point. I have had experience of building, configuring and operating in production a Grafana Instance hosted in Azure Kubernetes Service. This was by deploying its helm chart https://github.com/grafana/helm-charts/blob/main/charts/grafana/README.md
Given my experience with Grafana, I like to point out what I like about Azure Managed Grafana.
1. Ease of deployment. This is an obvious advantage as you don’t have to do install, setup and configuration. Although its helm charts are relatively easy, but with Azure Managed Grafana is is even easier. I am able to stand it with a few clicks.

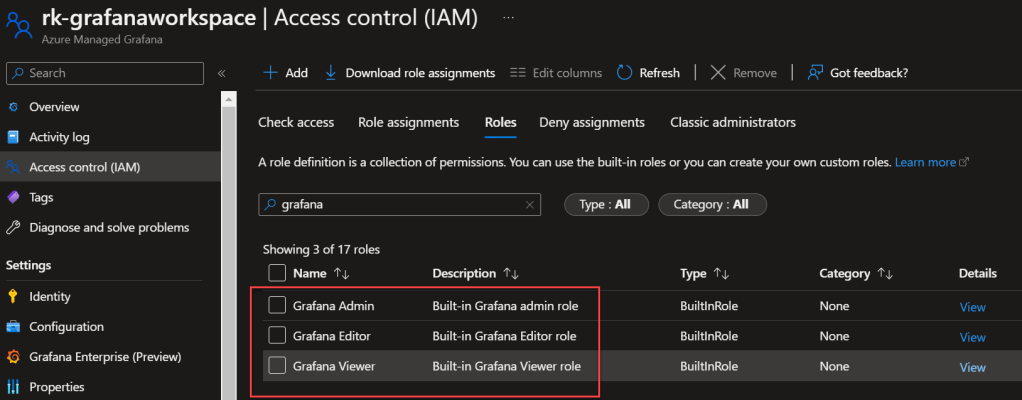
2. Access Management. Managed Grafana leverages Azure AD for access management. The RBAC roles available are as follows

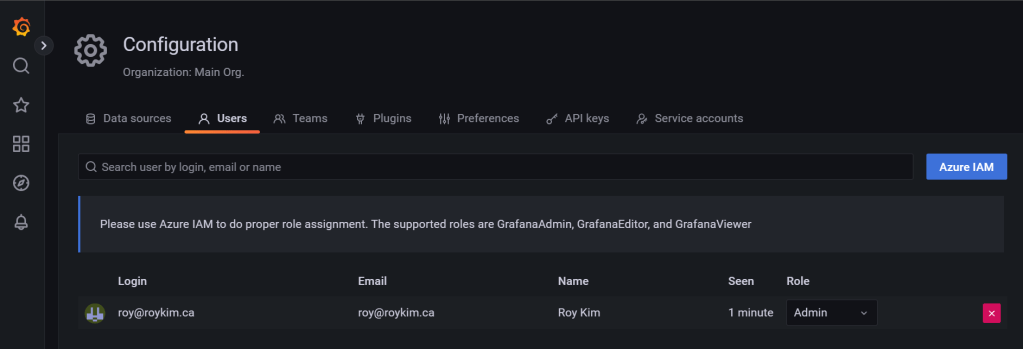
By adding role assignments in Access Control is reflected in the Grafana > Configuration > Users tab. This way it is easy to provide access to your team and customers.

And grant granular access and permissions to a specific dashboard

3. Service Reliability with Zone Redundancy. Where Managed Grafana is used for critical purposes, the VMs supporting the Managed Grafana instance can be spread across availability zones in supported regions.
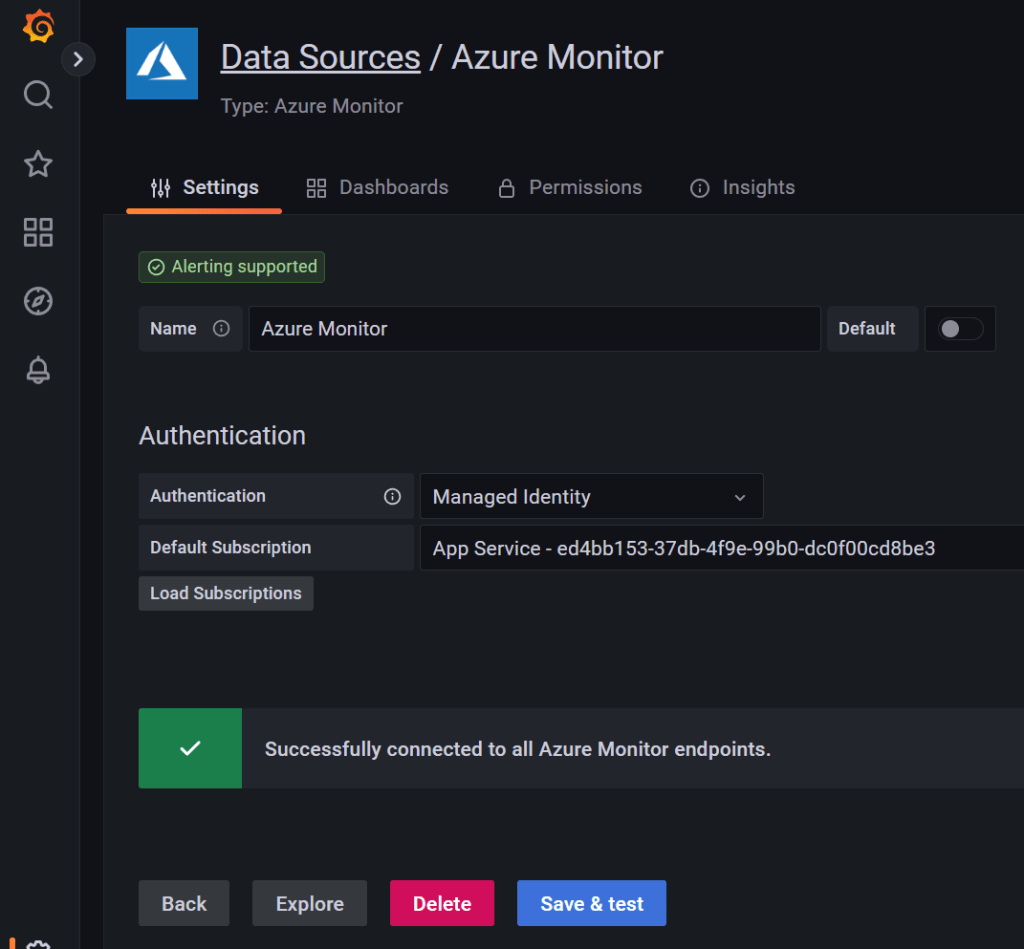
4. Multiple Data Sources. Managed Grafana supports many data sources yet it is easy to configure Azure data sources such as Azure Monitor and Azure Data Explorer.
Here is a configuration setup screen on setting up Azure Monitor as a data source

Here is a list of some its dashboards

4. Rich Dashboard and Data Visualizations. The core strength of Grafana is for its rich visualization and the ability to configure and develop them. There is nothing significantly unique with with Azure Managed Grafana, but compared to Azure Monitor, I find its is an overall better data visualization product.
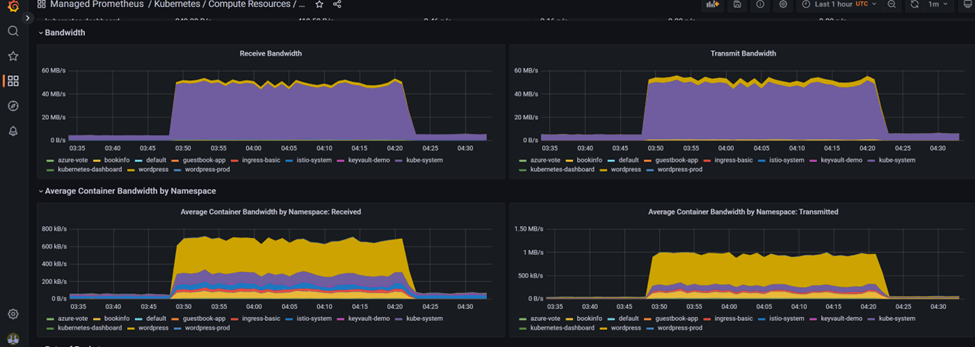
Some example charts seen here with applications running in AKS

What is cool that with developing dashboards, you can build them and save them in a git repo as a JSON model. You don’t have such rich capabilities in Azure Monitor dashboards.

5. Data Encryption. This is handled for you with Azure Managed Grafana as the encryption model is server-side encryption with service-managed keys.
All key management aspects such as key issuance rotation, and backup are managed by Microsoft.
Reference: https://learn.microsoft.com/en-us/azure/managed-grafana/encryption
6. Cost. The pricing to me is reasonable but can get costly when you have many active users. https://azure.microsoft.com/en-us/pricing/details/managed-grafana/

Final Remarks
This is definitely a service I would recommend especially with open source platforms such as Kubernetes. Grafana has such great community support and there are many plugins and dashboards to choose from. This along side with Azure Monitor would be greatly beneficial with monitoring cloud infrastructure and its applications.
To read the Microsoft documentation refer to https://learn.microsoft.com/en-us/azure/managed-grafana/
