
The following is a walk through of a quick setup of Azure Managed Grafana Instance and viewing performance graphs on applications running in Azure Kubernetes Service.
This is a relatively new Azure platform service and the general documentation can be found at https://learn.microsoft.com/en-us/azure/managed-grafana/how-to-data-source-plugins-managed-identity?tabs=azure-portal
I have had experience to build, configure and deploy Grafana into an AKS cluster in a production environment a few years ago. I find it exciting to be able to see the option of an azure managed service for easy setup and faster delivery.
One thing to note is that Prometheus has to be installed in the Kubernetes cluster which can be read at https://learn.microsoft.com/en-us/azure/azure-monitor/containers/container-insights-prometheus?tabs=cluster-wide#send-data-to-azure-monitor-managed-service-for-prometheus
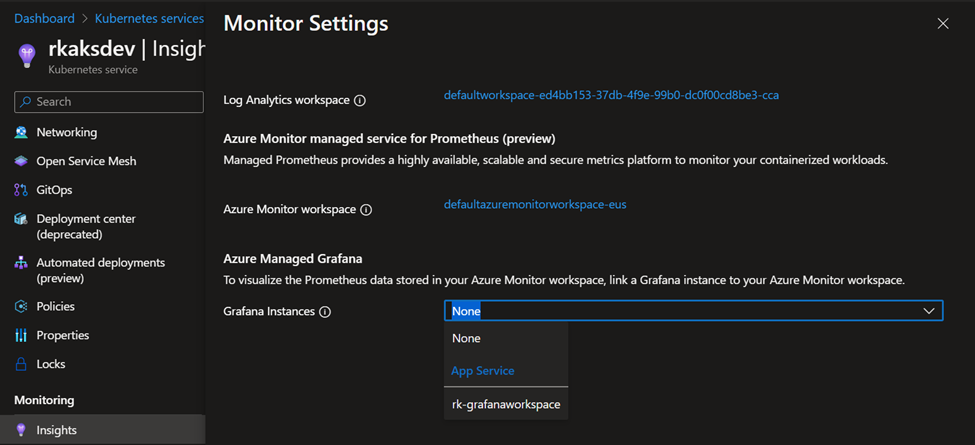
Setting up Prometheus is super easy and you just have to go to Monitor Settings and click through the prompts to enable Prometheus. This will create an Azure Monitor workspace.

Here are my steps starting with from my AKS service and in the Insights blade. In top top right we can see an option to “View Grafana”

Clicking View Grafana leads to link to a Grafana Instance; however, one does not exist.

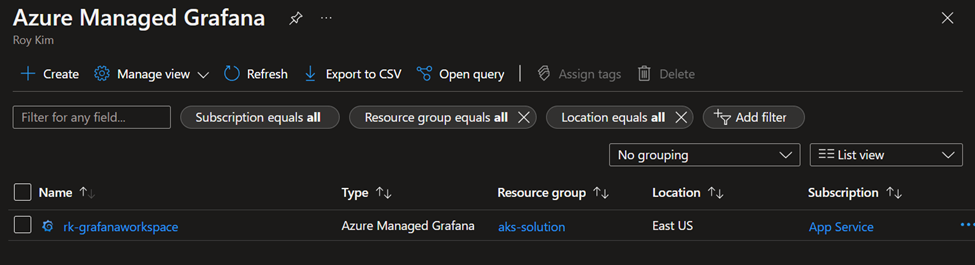
Therefore, one has to be created and let’s search in Azure Portal for Azure Managed Grafana and create a new resource.

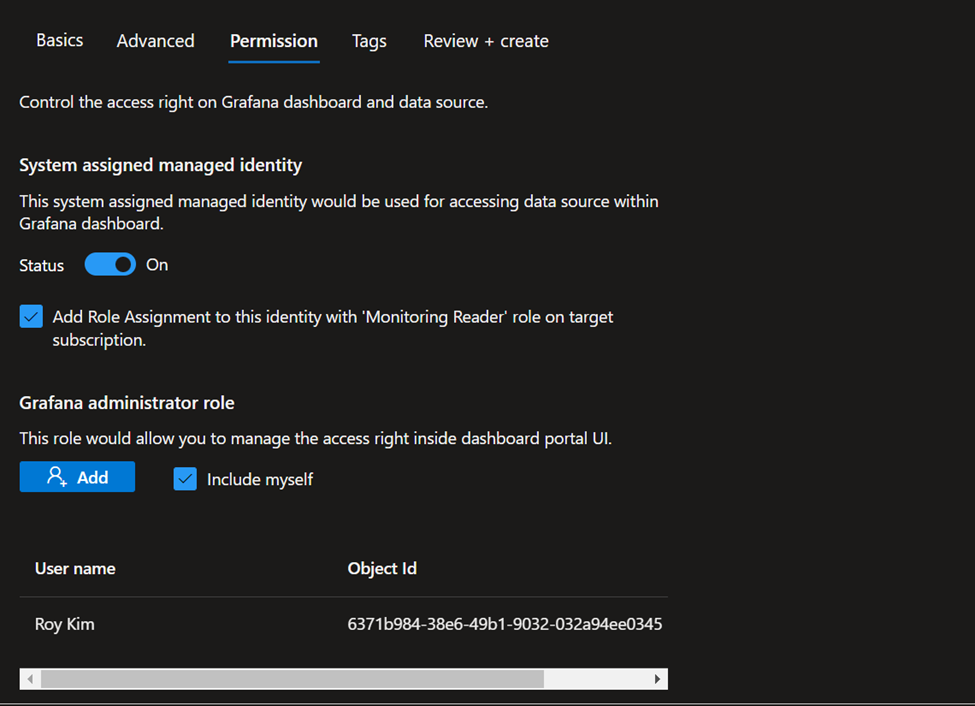
I select the following configuration settings.
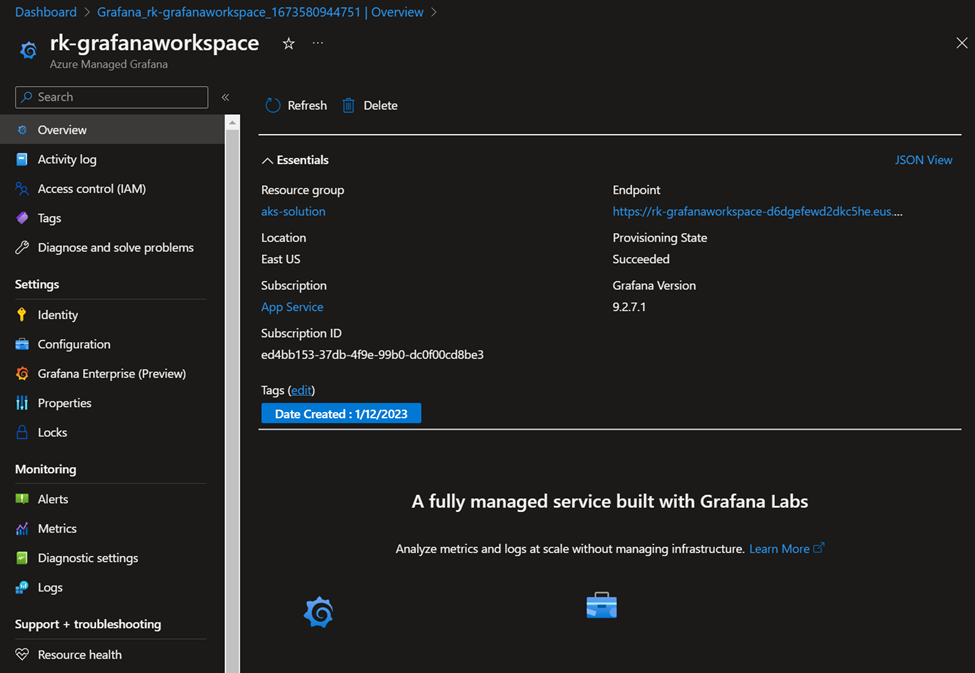
Upon deployment, here is the overview page and see its properties and the left hand menu blades.
To get an idea of pricing you can find at the azure pricing page https://azure.microsoft.com/en-us/pricing/details/managed-grafana/
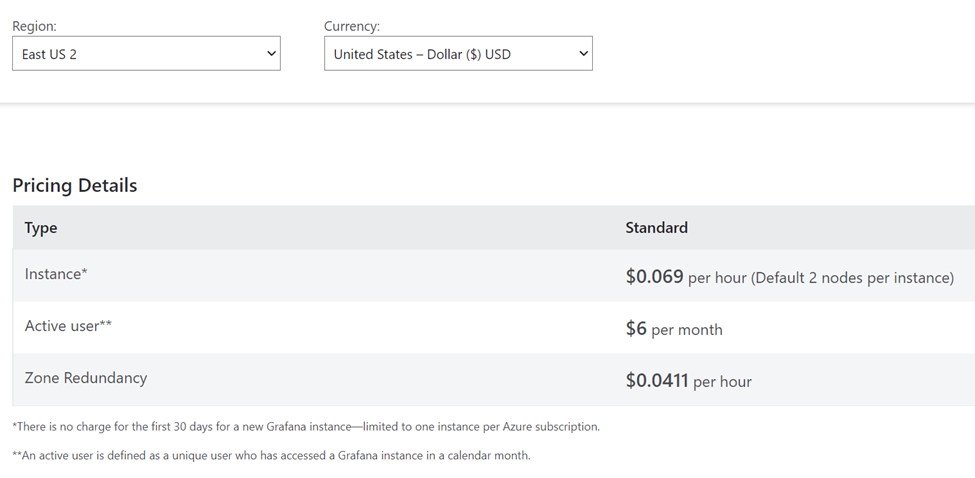
For an instance with 2 nodes and 1 active user, the monthly pricing comes to $56.37USD/month
Going back to my AKS > Insights blade, I know link to a Grafana instance
Opening up the workspace we can see dashboards such as Kubernetes Cluster.

My AKS cluster has a few apps where it is under load and traffic. CPU utilization is seen.
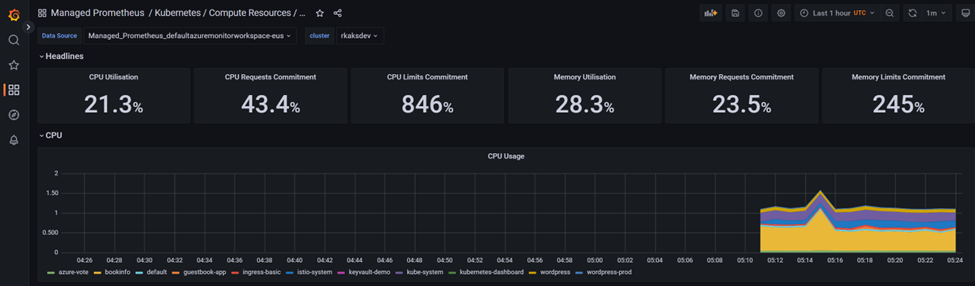
A breakdown of cpu usage, cpu request and limits for various applications and platform software under load.

The following screen shots shows more performance metrics which are better presented than Azure Monitor Container Insights.
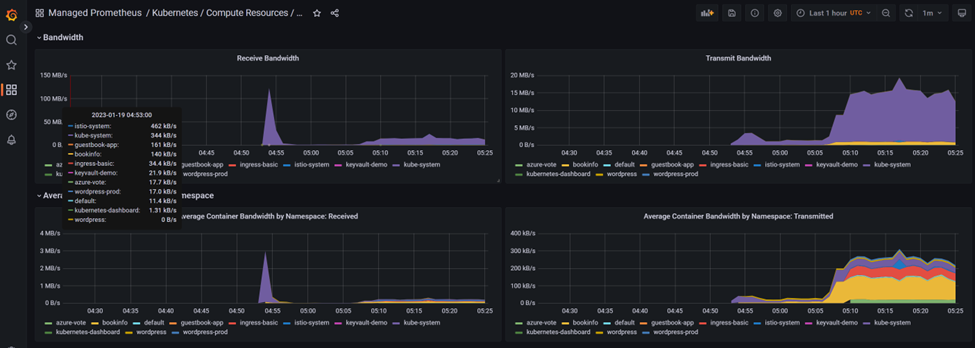
Grafana as the visualization tool is a much welcomed service to get more insight into your Azure Kubernetes cluster.
