From my previous blog post Monitoring Virtual Machines with Azure Log Analytics Part 1, I have shown Log Analytics connecting to virtual machines to collect telemetry data. This post will show how to query and display tables and charts.
In the Log Analytics workspace, click for Log Search. This is the simple query editor against the telemetry data.
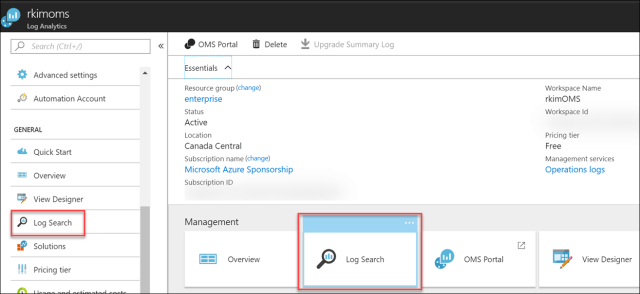
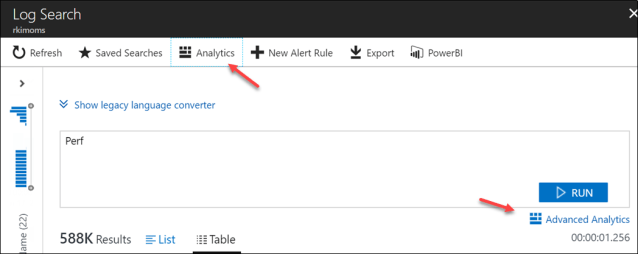
To get performance counters from all collected Azure resources, run a query “Perf” as follows:

You can see performance counters collected such as memory available, network adaptor bytes received and disk transfer.
For a more advanced querying editor experience click on Analytics.
A separate web application will be launched dedicated to log analytics which is outside of the Azure Portal.
In the left pane, there are various tables and their columns representing the data’s schema. The table Perf under LogManagement is the one I am working with.
In the top-middle pane, is the query window and bottom-middle pane is a rendered line chart.
In the right pane, are my saved queries and OOTB queries from OMS solutions I have previously added.

I prefer to use this Advanced Analytics query application over the Log Search functionality in the Azure Portal under the Log Analytics resource for the sophisticated capabilities.
To help learn how to build queries you can read the documentation Azure Log Analytics Query Language
Here are my queries for that I have adapted from examples to serve my solution.
CPU:
// Hourly average of CPU usage across all computers
Perf | where CounterName == "% Processor Time" and InstanceName == "_Total"
| summarize CPU_Time_Avg = avg(CounterValue) by bin(TimeGenerated, 1h), Computer
Free available memory:
// Hourly min free memory Megabytes
Perf | where ObjectName == "Memory" and CounterName == "Available MBytes"
| summarize Available_MBytes = min(CounterValue) by bin (TimeGenerated, 1h), Computer
| order by TimeGenerated
Free Disk:
// Hourly min free Disk Megabytes  (for all logical drives)
Perf | where ObjectName == "LogicalDisk" and CounterName == "Free Megabytes" and InstanceName != "_Total"
| summarize Disk_Free_MB = min(CounterValue) by bin (TimeGenerated, 1h), Computer, InstanceName
Disk I/O:
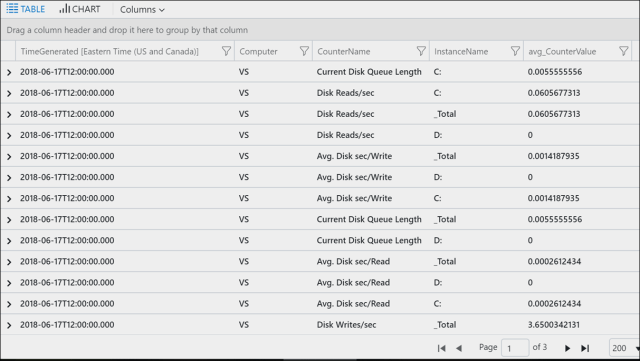
// Disk I/O performance by hour and computer
Perf | where CounterName == "Current Disk Queue Length" or CounterName == "Disk Writes/sec"  or CounterName == "Disk Reads/sec" or CounterName == "Avg. Disk sec/Read" or CounterName == "Avg. Disk sec/Write" | summarize any(CounterValue) by bin(TimeGenerated, 1h), Computer, CounterName, InstanceName
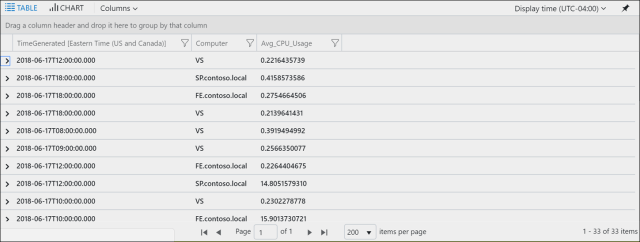
For Disk I/O, we can see the result in a table output
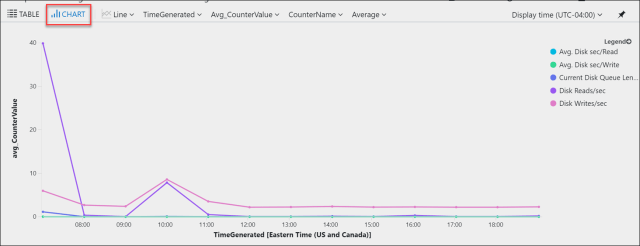
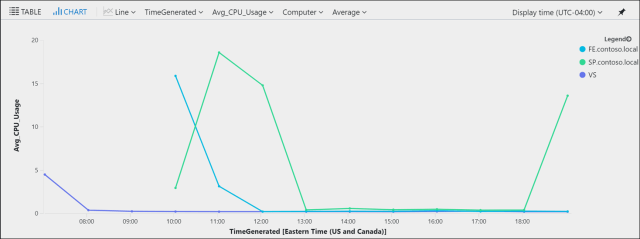
We can also see in a visual line chart the average of the counters across all disk drives from all running VMs.
For CPU average by hour per VM
As a line chart
Next let’s explore how to create a dashboard using the Azure Portal Dashboard so that we can publish and share with others. Read the next blog Monitoring Azure Virtual Machines with Log Analytics Part 3: Dashboard
References
