
Azure provides a rich set of capabilities for monitoring your Azure resources. Although there is a great deal of documentation and various ways of monitoring services such as Azure Metrics, Application Insights and Azure OMS Log Analytics. I will demonstrate a specific approach to a specific solution that serves to be practical and useful.
Provide a chart and dashboard that is monitoring Azure virtual machines by
- CPU average
- Free available memory
- Free disk space
- Disk I/O
This is useful in scenarios for performance testing and more importantly operational management and support in production.
I will show how to collect, query, visualize and publish performance metrics for monitoring Azure virtual machines using Azure Log Analytics.
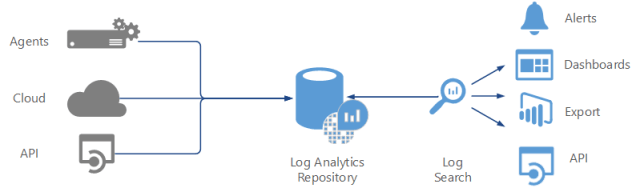
So what is Azure Log Analytics?
“Log Analytics plays a central role in Azure management by collecting telemetry and other data from a variety of sources and providing a query language and analytics engine that gives you insights into the operation of your applications and resources.” – source
 Note that Log Analytics is part of the Operation Management Suite (OMS)
Log Analytics Workspace
“A workspace is essentially a container that includes account information and simple configuration information for the account. You or other members of your organization might use multiple workspaces to manage different sets of data that is collected from all or portions of your IT infrastructure.” – source
In my Log Analytics workspace, the virtual machines monitored needs to be connected as a data source. When doing so, it will take roughly several minutes or more to collect the data into the log analytics repository where then it can be queried.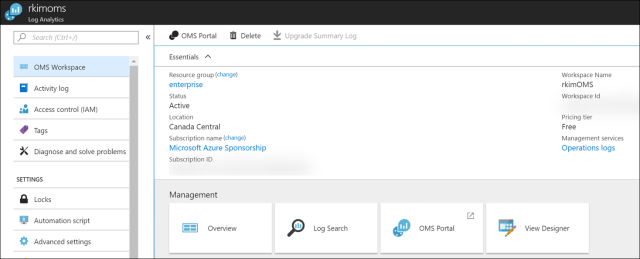
The various blades under this workspace are as follows to get an idea of the set of features and capabilities.

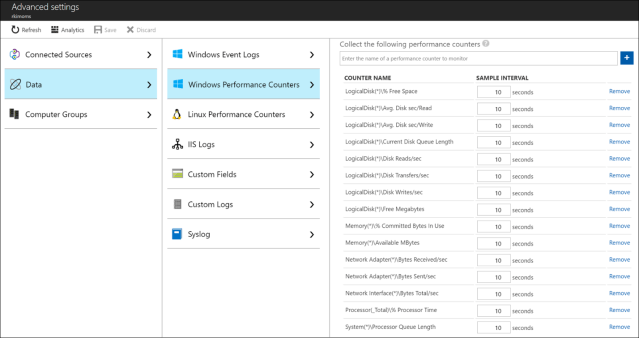
Collect Data
Let’s look my configuration collecting the data telemetry from the Azure virtual machine(s)
- Go to Advanced Settings > Data > Windows Performance Counters, ensure to click on the blue button “Add the selected performance counters” and the desired checked off counters.
As a result, it should look like
- Go to back to the workspace and go to Virtual machines to list the virtual machines to check for an OMS connection status.
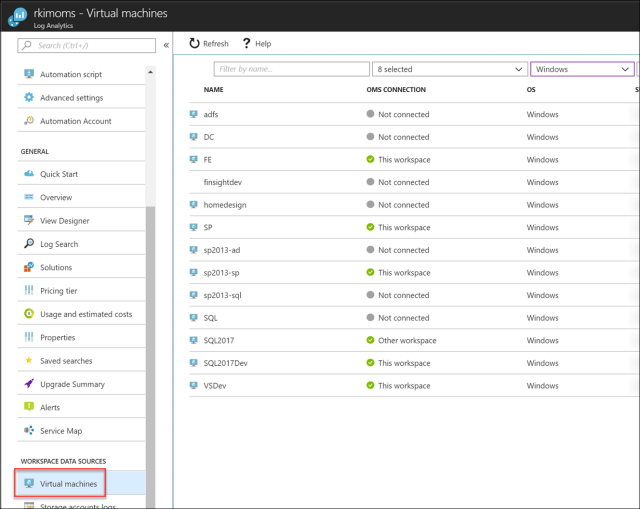 Click into the virtual machine to connect or disconnect. Ensure the connection exists. Note that the virtual machine must be running because by connecting, a monitoring agent will be installed as a VM extension.

- Verify monitoring extension is installed on the virtual machine.
Go to the virtual machine resource and click on the Extensions blade
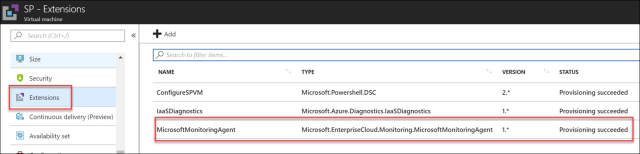
Now your log analytics will be collecting and populating its repository.
Next we will look at querying the collected data, read Monitoring Azure Virtual Machines with Log Analytics Query Language Part 2: Querying
References

Pingback: Penetration Testing Your Web App with Azure Application Gateway WAF Part 3: Log Analytics – Roy Kim on Azure, Office 365 and SharePoint