As shown in my previous post, the log analytics query can return a table or a chart. In this blog post, I will show how to put together various tables and charts together in a dashboard style and for others to see.
I will show how to create a dashboard with Azure Portal’s dashboard capability. You can create new dashboard apart from the default dashboard to support
- A dedicated dashboard intended for VM monitoring
- Enable sharing and publish to others.
- Assign a set of users who is able to view the dashboard
This is useful for scenarios where you have different teams that focus on performance monitoring, operations support, application development, infrastructure engineers, etc. And have a dashboard for each team with the appropriate charts and visualizations.
Creating a Dashboard
Apart from the default dashboard, I have created a separate portal dashboard specific to my virtual machine metricss called “VM Analytics”. Note that this is not the “dashboard” that is part of OMS log analytics workspace.

Click “+ New Dashboard”. Ensure that the dashboard is shared by clicking on Share so that it can be viewed by others who are given access.


Click Publish.
Click Manage users, and then add desired users that can access this dashboard.

For users to have read-only access to the dashboard, add users with the reader role
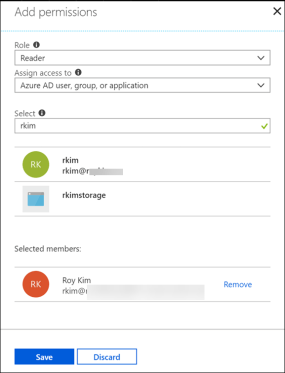
Also, these users also need permissions to read the Log Analytics. So, go to the Log Analytics, and add a user with the Log Analytics Reader role.

Go back to Log Analytics Query Editor and run each log analytics query and pin the table and/or chart in order to display in your shared dashboard.
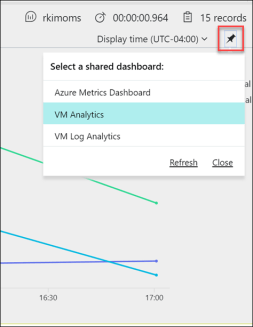
Choose the shared dashboard to pin to and you will be see confirmation.
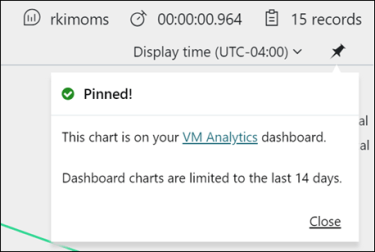
And you will see the tile placed in the dashboard. You can then move, resize or edit the tile.

Click the pencil icon to edit the tile and sub title.
Click Update

Click Publish Changes so others who have read access are able to see the changes.
And repeat these steps for other queries in order to add them to the dashboard.
The following is the final dashboard from the point of view of a user who only has read only access to the dashboard.

Note this logged in user, has the ability to edit the dashboard but is only allowed to save their own copy.
Another approach of creating dashboards is through the OMS Log Analytics workspace.
In summary, I have walked through an end to end solution of building a dashboard of Azure virtual machine metrics that can be published and shared to others. This is useful for operations teams that need to monitor their Azure virtual machines.
References

Pingback: Performance Monitoring Azure Virtual Machines with Log Analytics Part 4: Log Analytics Custom Views – Roy Kim on Azure, Office 365 and SharePoint