Continuing from blog post Part 2.
Azure Sentinel Workbooks provides custom dashboard to see the data in the form of visualizations and tables. These data presentations are based on queries to the log analytics workspace. You can create a workbook from scratch or leverage built-in workbooks by starting from templates.
For the Web Application Firewall (WAF), there are three templates to choose from
- WAF – firewall events
- WAF – gateway access events
- WAF – overview
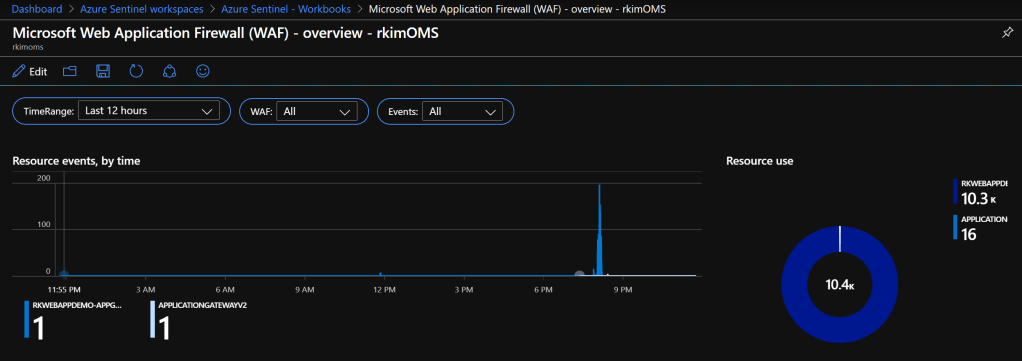
Let’s save a workbook from the WAF – overview template

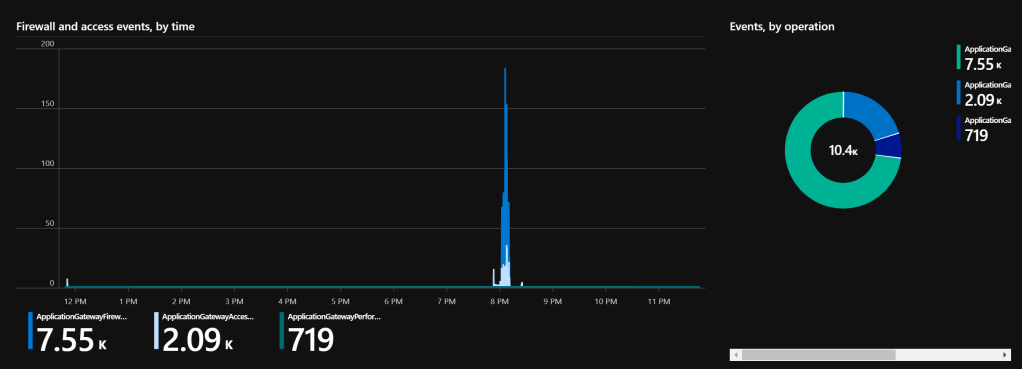
Since this workbook is based of a template, you can edit and modify existing reporting visualizations and queries. You can also remove or add your own.
In the edit mode the column chart for the screenshot above, you can adjust the query to your preferences.

You can also modify the chart settings

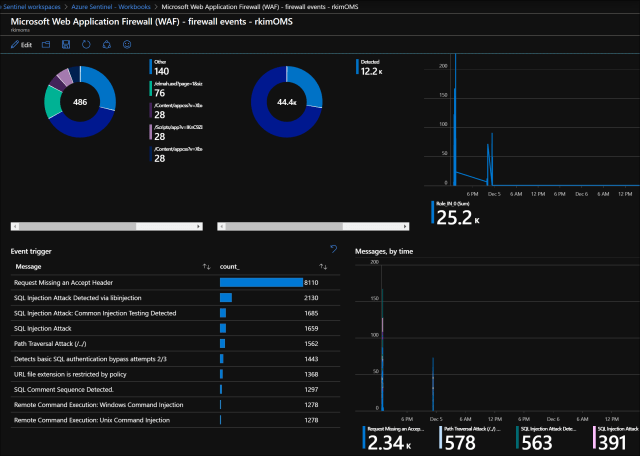
For the WAF – firewall events workbook, here is a screenshot. I particularly like the most occurring events triggered from most to least.
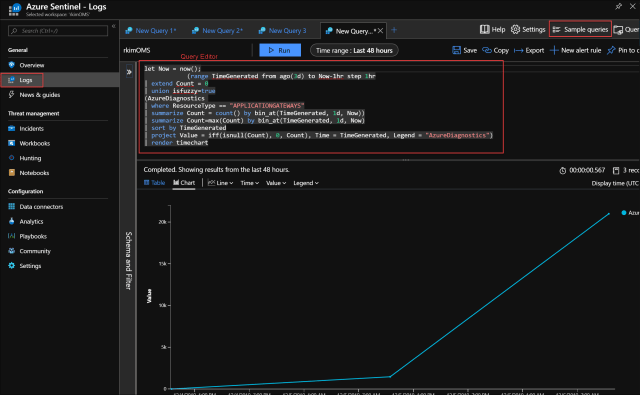
To monitor and analyze with your own queries and start with some sample queries, go to the Logs blade to find the query editor. You can click on Sample Queries to choose from.
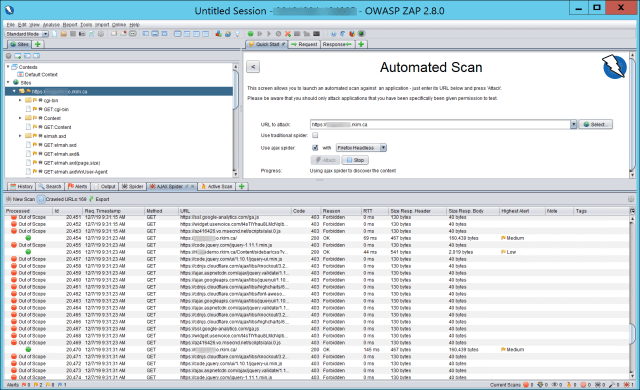
So how were these WAF events triggered?
I used the OWASP ZAP tool and pointed it to the URL of the web application that is being protected by the App Gateway. OWASP ZAP is a free penetration tool to help find web vulnerabilities.
We have looked at the how to monitor and analyze WAF event data in a visual charts and through custom querying. You can notice that Log Analytics Query is the basis of monitoring. To learn more about the query language read Azure Monitor log queries.
To continue reading, click for Part 4 Analytics alert rules of web attacks.

Pingback: Using Azure Sentinel with Azure App Gateway to Investigate Web Attacks – Part 1 Intro – Roy Kim on Azure, Office 365 and SharePoint