To continue in building upon the scenarios of this blog series, I will show how to create an Azure Alert for a VMs that have an average CPU utilization greater than 90% over a 10 minute period. And continuing to leverage Log Analytics.
Specifications Summary
- Alert on any VM that has an average CPU utilization of greater than 90% over 10-minute period
- Alert rule criteria includes the number of breaches (aka over 90% threshold), during 10 minutes, at least once.
- Evaluate alert criteria every 5 minutes and fire alert if met.
- Notify via an email address and SMS phone text message
- Use log analytics search queries as opposed to azure metrics
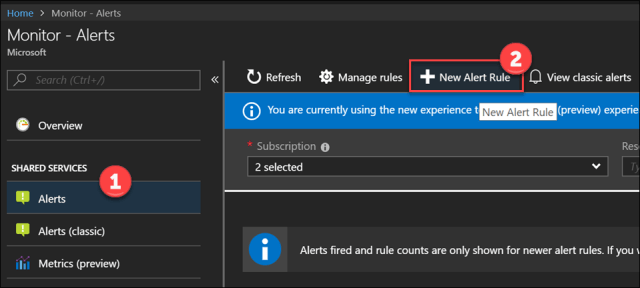
Go to Monitor blade
Click on New Alert Rule
We must select an alert target. Since I am trying to alert on all running VMs based with log analytics search, I target my log analytics workspace.
Click Select Target to open right pane.
Select Subscription and Log Analytics as the resource type
Select your existing log analytics workspace

Create Alert criteria that will define the conditions to trigger the alert.
Click Add Criteria and then Custom log search. Click Done
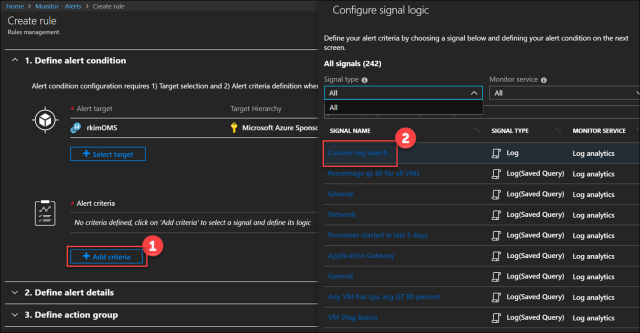
Next, configure the signal logic that is part defining the criteria.
Search Query: Enter the log search query.
Perf
| where CounterName == “% Processor Time” and InstanceName == “_Total”
| summarize AggregatedValue = avg(CounterValue) by Computer, bin(TimeGenerated, 10m)
To see how this search query results look like in log search
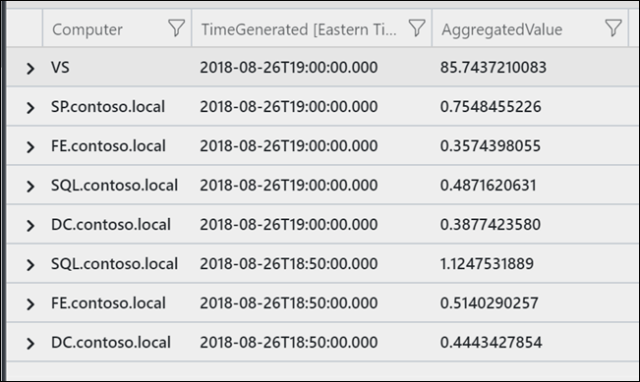
Note that AggregatedValue needs to be the name of the property/column of the aggregate calculation. This is how the alert logic knows to evaluate the metric measurement. Also the query needs to have bin(TimeGenerated, <time period>) grouping. Otherwise, there will be an error message indicating these two requirements clearly.
Alert Logic: There are two choices, Metric measurement or Number of Results. I have chosen Metric measurement as this can evaluate against a configurable threshold. In my case, a value of 90.
If you were to go with the Number of Results approach, then your query can be “Perf | where CounterName == “% Processor Time” and InstanceName == “_Total” | summarize AggregatedValue = avg(CounterValue) by Computer, InstanceName, bin(TimeGenerated, 10m) | where AggregatedValue > 90” and set Number of Results > 0. But one disadvantage is that the threshold is part of the query and not as configurable through well defined paramaters.
Trigger Alert Based On: I have chosen Total breaches over Consecutive breaches as I am concerned with simply at least one occurrence or breach over the threshold that occurs during the set time period.
Evaluate based on: The time period is set as 10 minutes as this filters the search query results to be only during the duration of 10 minutes. That is, even if the search query can return the last 7 days of results, this alert will only look the last 10-minutes. For Frequency, I have set 5 minutes, this is how often the search query is executed and collects the data points and evaluates the alert logic. If the logic is met, then the alert is fired. And so, if the logic passes, an alert can be fired every 5 minutes.

To find the official documentation to explain these configuration parameters, read Log search alert rule – definition and types
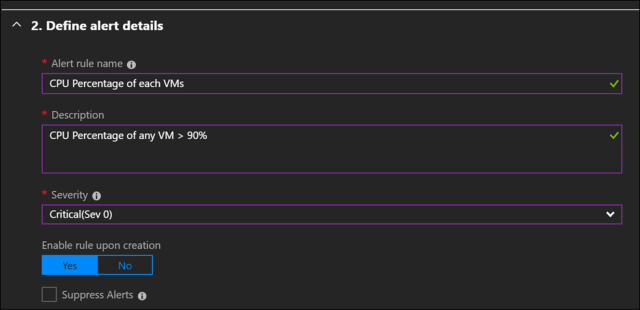
Define alert details by simply populating the fields. Pretty self-explanatory.
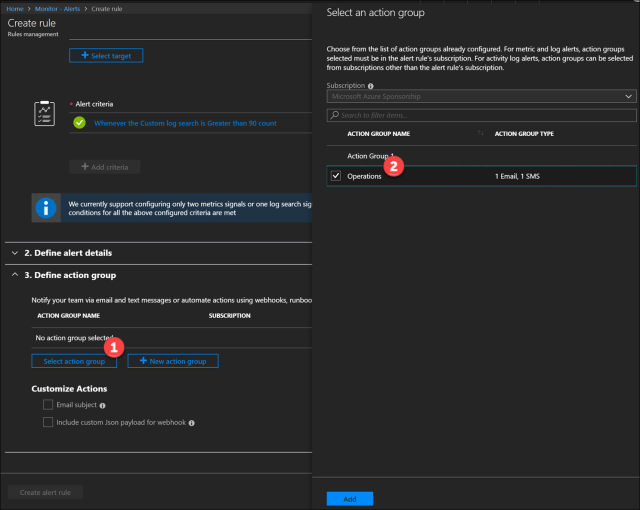
Finally, we have to define the mechanism for notification. It can be through email, SMS text message and/or web hook.
In Define action group, I have an existing action group called ‘Operations’ which is notifies me to my email and my phone by text message.
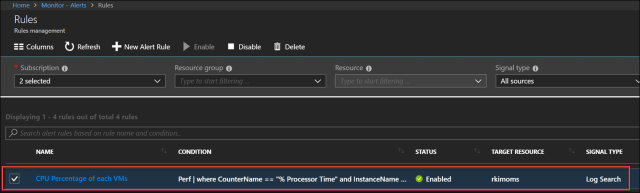
When the alert rule is created, you can go to Rules, and see the created alert rule.
To test the alert rule, I generate high CPU load in the virtual machine, named VS, over a 30 minute period. I received 5 alert notification and one of them looks like as follows:
Email

SMS Text Message

You can see not too much too much details.
You can also see a history of all alerts fired

For available memory and disk, you can create similar alert rules with the queries:
Perf | where ObjectName == “Memory” and CounterName == “Available MBytes” | summarize AggregatedValue=min(CounterValue) by bin(TimeGenerated, 1h), Computer
Perf | where ObjectName == “LogicalDisk” and CounterName == “Free Megabytes” and InstanceName != “_Total” | summarize AggregatedValue = min(CounterValue) by bin(TimeGenerated, 10m), Computer, InstanceName
Final Remarks
I have shown a walk-through configuration of an alert rule and some explanation of fulfilling this scenario. One may create alert rules using the Azure metric signal type which is very easy to get started, but you have to target at each individual VM which can become tedious to manage with many VMs.

Azure Alerts using the log search signal type is more powerful and flexible as you may have numerous azure resource varying resource types to oversee.
References
