This is an introductory walk through of querying hive tables and visualizing the data in the Ambari Hive View. This is another option to build and debug HiveQL other than in Visual Studio with the Azure Data Lake Tools plugin. In my blog article Populating data into hive tables, I demonstrated populating internal and external hive tables and this article will build on that.
“Hive is a data warehouse infrastructure built on top of Hadoop. It provides tools to enable data ETL, a mechanism to put structures on the data, and the capability to query and analyze large data sets that are stored in Hadoop. The Hive View is designed to help you author, execute, understand, and debug Hive queries.”
- Go to https://<yourcluster>.azurehdinsight.net
- Click on the top right waffle > Hive View

- In my Hive, I click on my database usdata and its two tables crimes and crimes_ext. You can see its schema.

- I query the number of rows in my crimes table to show it being quite large.

- A query to show the number of each type of crime for years before or at 2017.

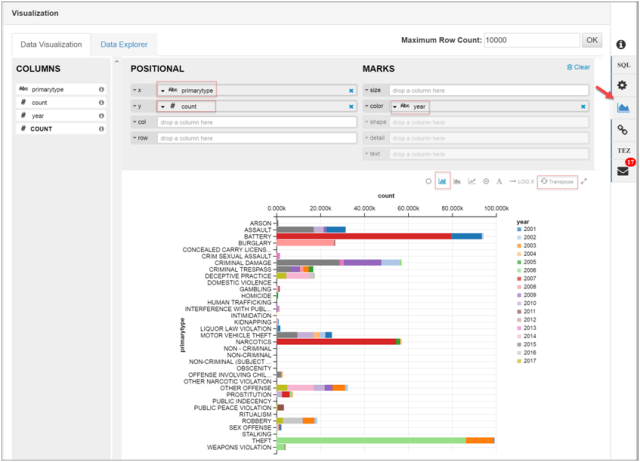
The execution took about 2-3 mins with 2 worker nodes in the cluster. - Clicking on Visualization tab on the right, I am able to visualize the data in my last query. The red squares indicate settings and clicks to arrive to the stacked bar chart.
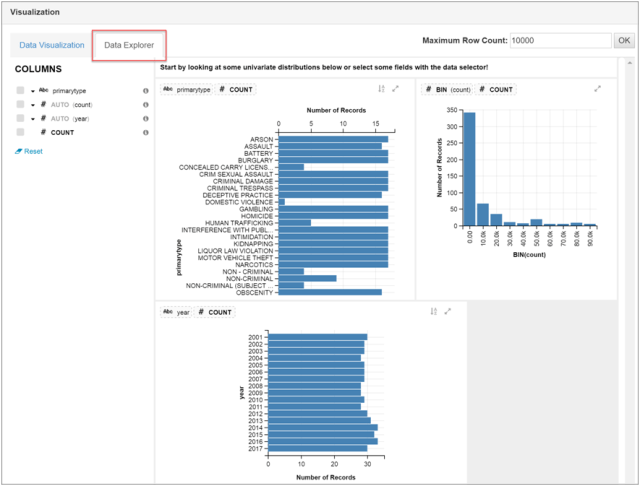
- Click Data Explorer to explore to see various charts defined automatically based on the columns in your query.
I have shown a brief introduction of Ambari Hive views with queries. This is one of the tools for data analysts and developers to quickly and easily build hive queries.
