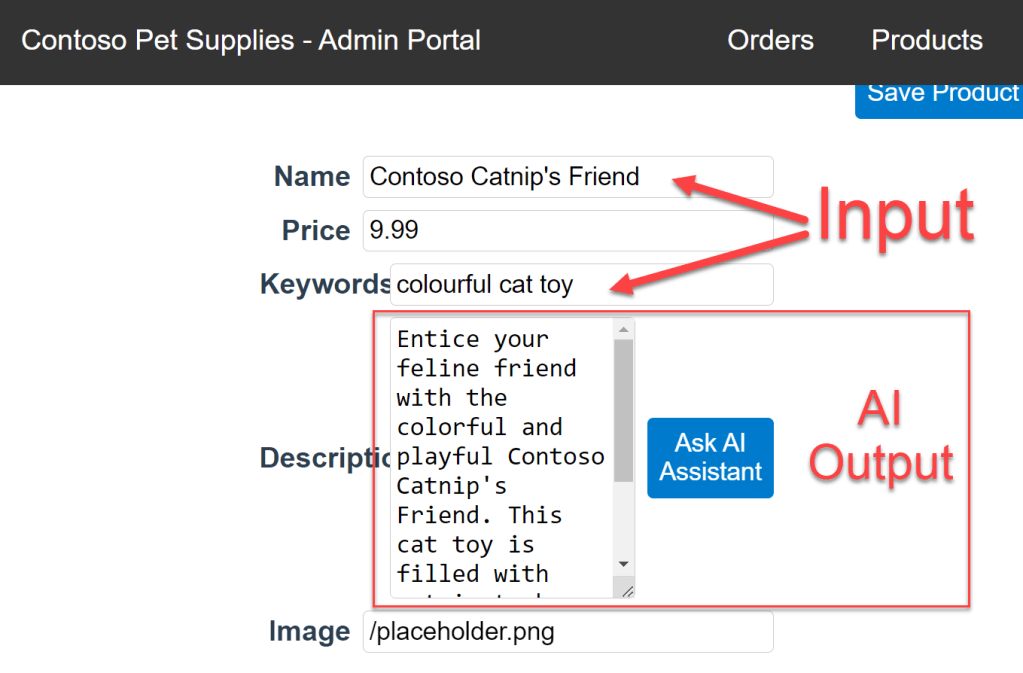
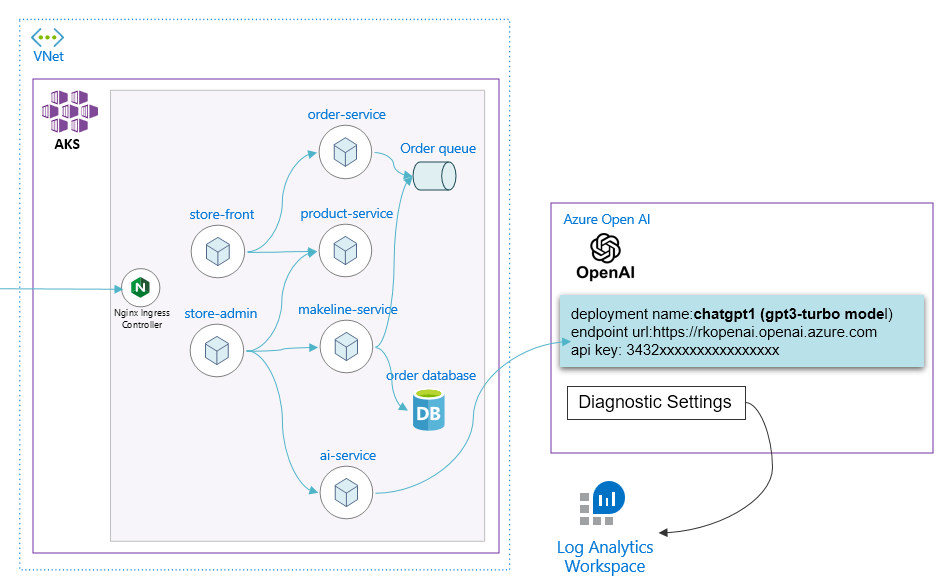
I like to showcase the practical scenarios of using Azure Log Analytics Workspace to monitor the AKS Demo Store application calling out to Azure Open AI to help author product descriptions.
This blog post is inspired by the MS Learn Doc https://learn.microsoft.com/en-us/azure/ai-services/openai/how-to/monitoring, and want to demonstrate my own app installation and provide my input.
Azure Log Analytics Workspace is a powerful tool for monitoring and gaining insights into various aspects of your Azure infrastructure, including Azure OpenAI and Azure Kubernetes Service (AKS). You can query for the logs and metrics collected from Azure Resources.
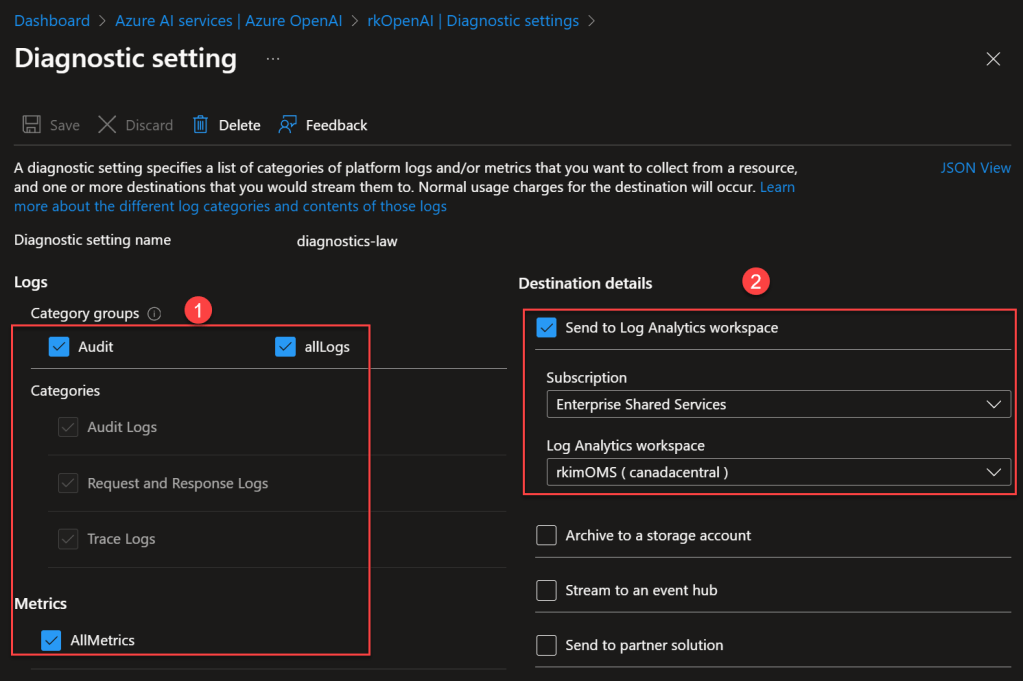
To collect from AKS and Azure Open AI, go to the Diagnostics Settings blade

My configuration after setup of collecting both logs and metrics. Logs are detailed, textual records that capture specific events, activities, or transactions. Metrics are quantitative measurements, typically numeric values that are based on time-series.
Here I am collecting audit, alllogs and allmetrics into a centralized log analytics worskspace where I also collect AKS and other resources’ logs and metrics.
Go to the logs blade, you can identify the tables AzureDiagnostics and AzureMetrics that stores the collected data and query for those tables with the Kusto query langauge.

A query example for metrics:
AzureMetrics
| where ResourceId contains "rkopenai"
| project TimeGenerated,ResourceId, MetricName, Total, Count, Maximum, Minimum, Average, TimeGrain, UnitName, OperationName, CallerIpAddress, SourceSystem, CorrelationId

Here is a basic query to show the more useful metrics specifically from the Azure Open AI resource called rkopenai.
Here is a visual chart view split by the MetricName. These metrics can help you analyze performance, failures, token generation as it relates to cost, etc.

For the exact number of Azure Open AI requests in a time grain of 1 minute we see the following:

And to compare the number of successful requests which has a 100% success rate.

From AzureDiagnostics table, we can query the logs. This has more details such a json of properties.
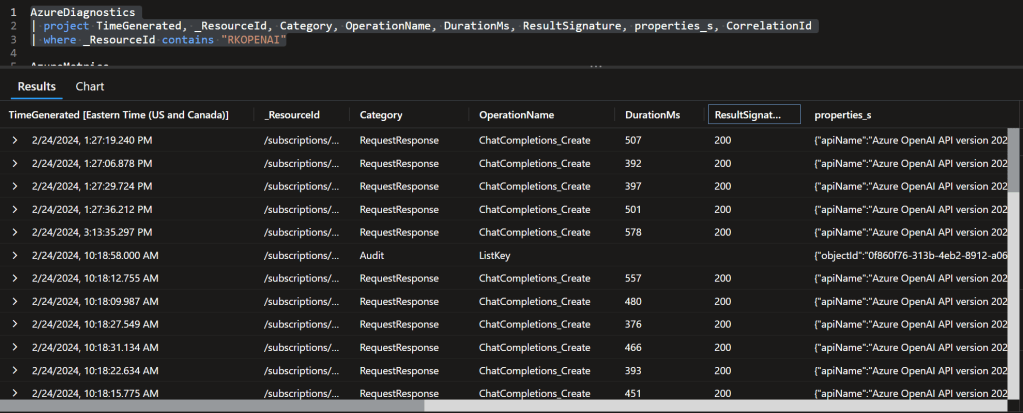
One of these properties shows details of the request such as the model deployment name and modelVersion.
{"apiName":"Azure OpenAI API version 2023-05-15","requestTime":638443960358335014,"requestLength":1931,"responseTime":638443960363409826,"responseLength":495,"objectId":"","streamType":"Non-Streaming","modelDeploymentName":"chatgpt1","modelName":"gpt-35-turbo","modelVersion":"0301"}
Also you can setup specific queries for alert configuration. For example, when latency is above a certain threshold, then send out an alert in the form of an email.
One important consideration to manage your Log Analytics Resource is to manage the data usage in order to manage the costs. You can do this by going to the Usage and estimated costs blade and click on data retention
I like to set my demo environment to be the minimum 7 days and I can see each data table’s data usage.

Data usage breakdown.
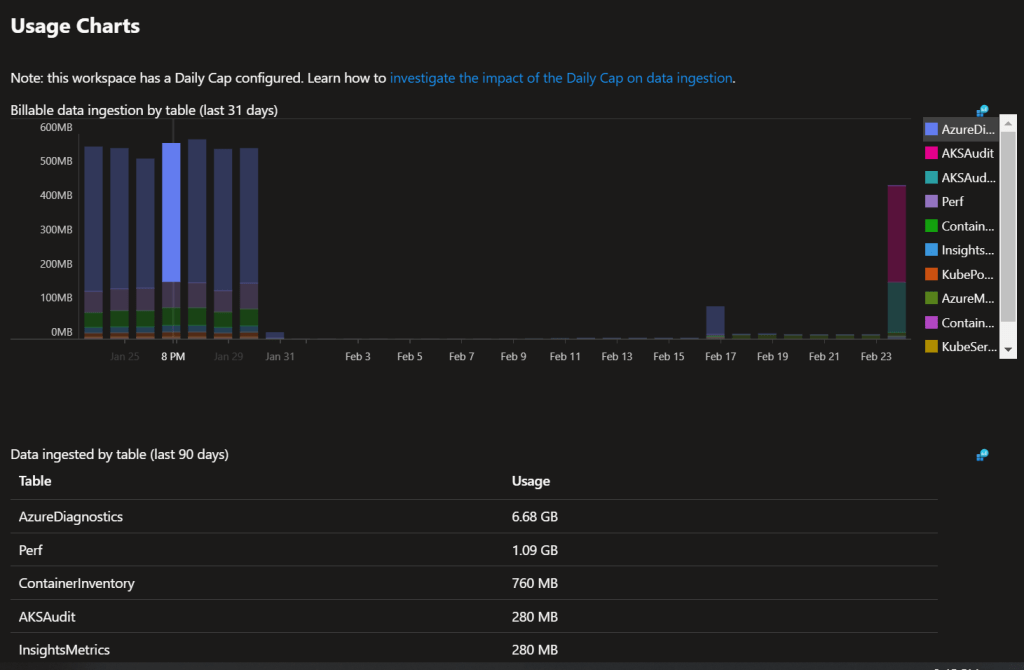
By seeing this break down, you can evaluate what kind of data is not relevant and disable that collection. For example, AKSAudit may not be necessary, so I would go to the AKS diagnostic settings and uncheck that log table. Here we don’t see anything specific to Azure Open AI as the log data collection is in AzureDiagnostics table. But watch out in the future as there can new specific tables.
Final Thoughts
I have given shown the capabilities and the data that can be queries from Azure Open AI as it relates to the AKS Demo Store app. It would be nice if there is data in the metrics and logs to show any detail of the calling resource which in this case is the AKS resource. I do feel there can be more data points to collect to help with analysis, troubleshooting and performance tuning but only time will tell as the product improves.
