JMeter is an free load testing tool. You can find it at https://jmeter.apache.org/download_jmeter
Comparing with other options freely available, I find this is has the right balance between being free, functionality and capabilities. I used to use Visual Studio Load Test tool but that is deprecated. The UI isn’t has intuitive and there is some learning curve, but once you get used to it, it is very capable to get the job done.
I will be showing how JMeter is applied to test 6 applications hosted in a single Azure Kubernetes Cluster and see the performance metrics through Azure Monitor for Containers.
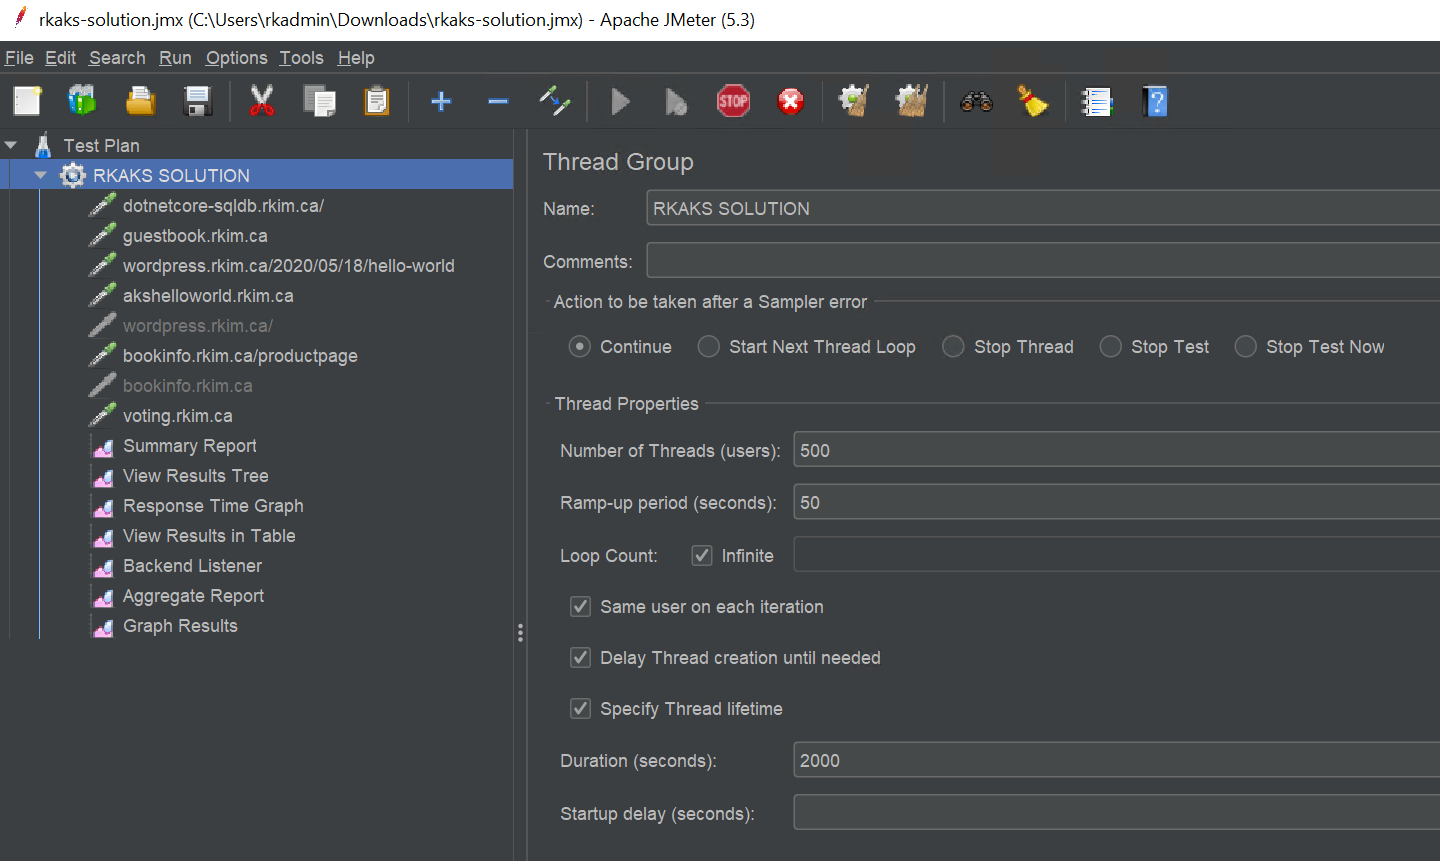
Here is a Test plan that shows all my http requests on the left side and listeners. The Summary report is one of the listeners that serves as testing output module.

HTTP Request Sampler
An HTTP Request to guestbook.rkim.ca is setup along with 5 other applications hosted in the same Azure Kubernetes Cluster.

At the Thread Group level, I configures the number of threads representing virtual users of 500 to generate the HTTP traffic against the HTTP samplers. Or in other words, the URLs of the applications. I have a ramp up of 50 seconds so that high amount of load is not applied all at once so that it doesn’t stress out the AKS cluster unnecessarily. I also set the load test duration for 2000 seconds. Each virtual user will simply loop through each of the http samplers in a loop.
The Listeners measure and display test metrics and output. In this case is an Aggregate report.

Another listener is the Response Time Graph showing the response time in milliseconds for each application. At first the response time is high, but improves as there is Kubernetes horizontal pod autoscaling and AKS cluster level autoscaling.

Now that the the load test has run, I turn to the Azure Portal to the Azure Kubernetes Service resource. In the monitoring section, I click on Insights. This takes me to the following screenshot to see cluster level metrics and visualizations.
Here we see a period of high CPU load, increase pod count and increased node count. As more load is generated the horizontal pod autoscaling creates more pods and in turn the AKS autoscaling generates more nodes. As there are more nodes, there is increased capacity of cpu and memory and so utlization % eases.

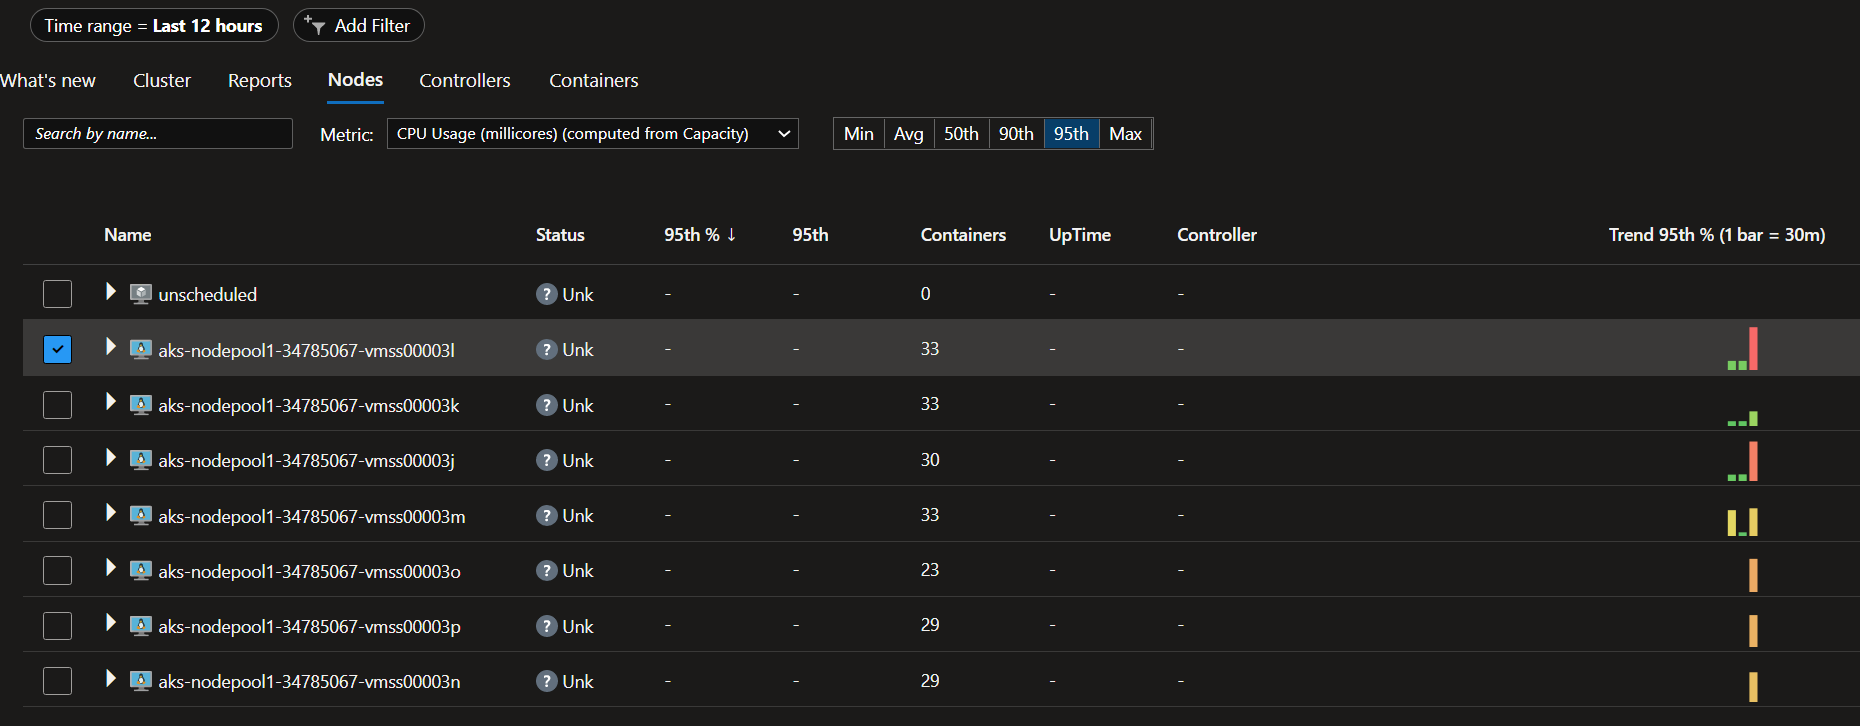
In the Nodes tab, we can see the various nodes and further metrics.
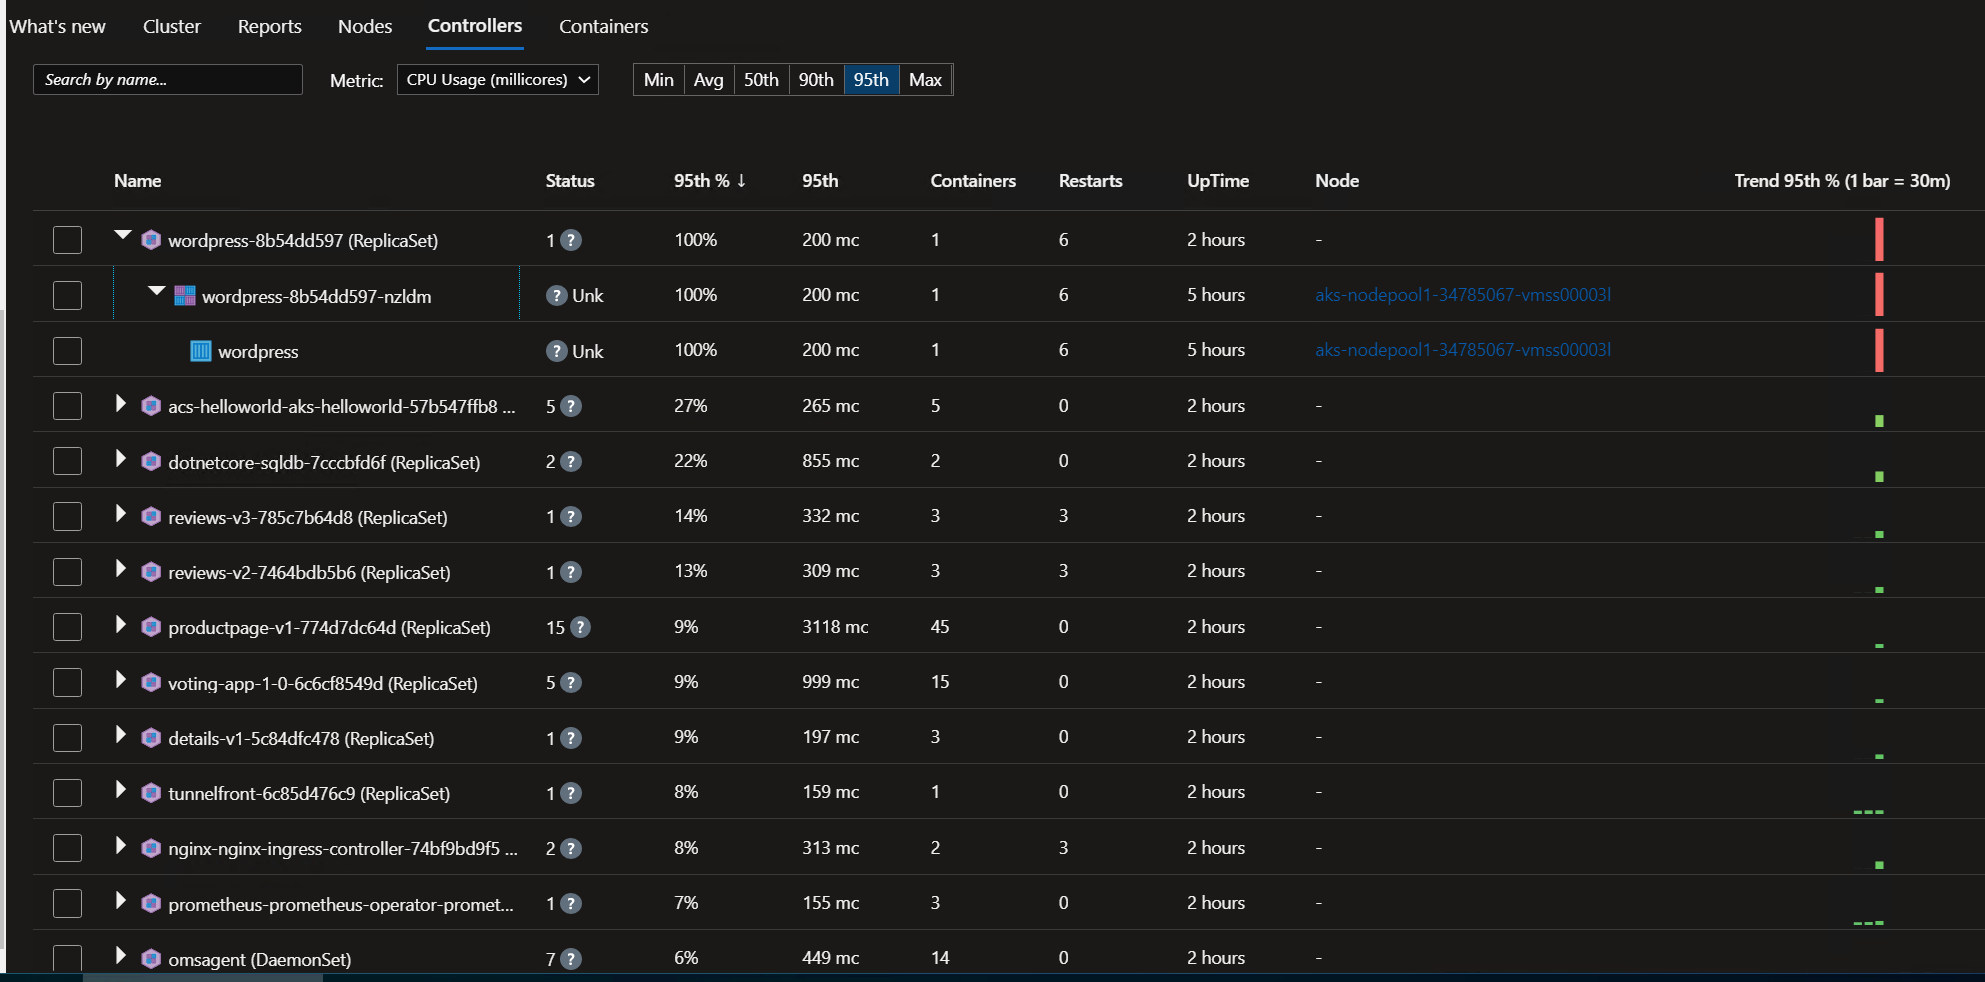
In the Controllers tab, where controllers are basically Kubernetes deployments or replica sets, you can drill down and see further metrics down to the pod and container level.
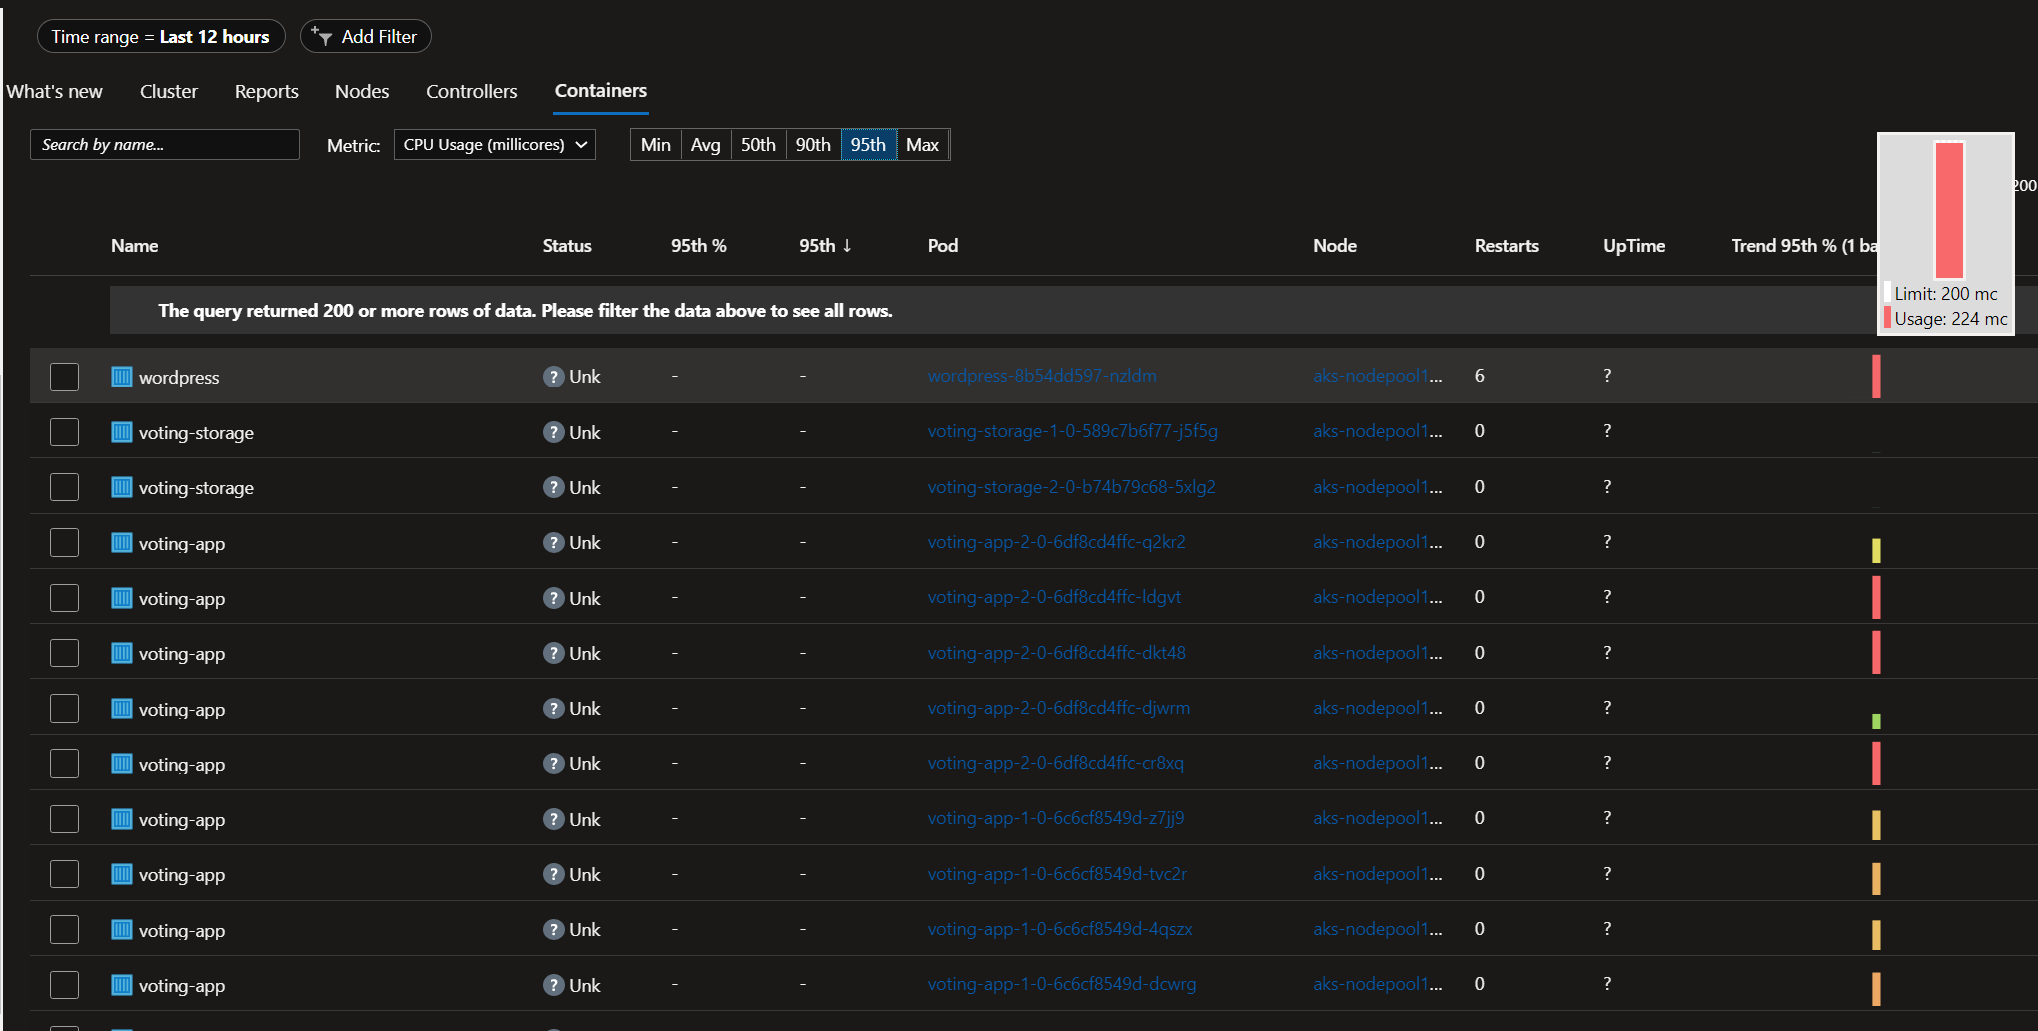
In the Containers tab, you see a more flat view of all the containers across and can see specific info such as the resource limit and requests.
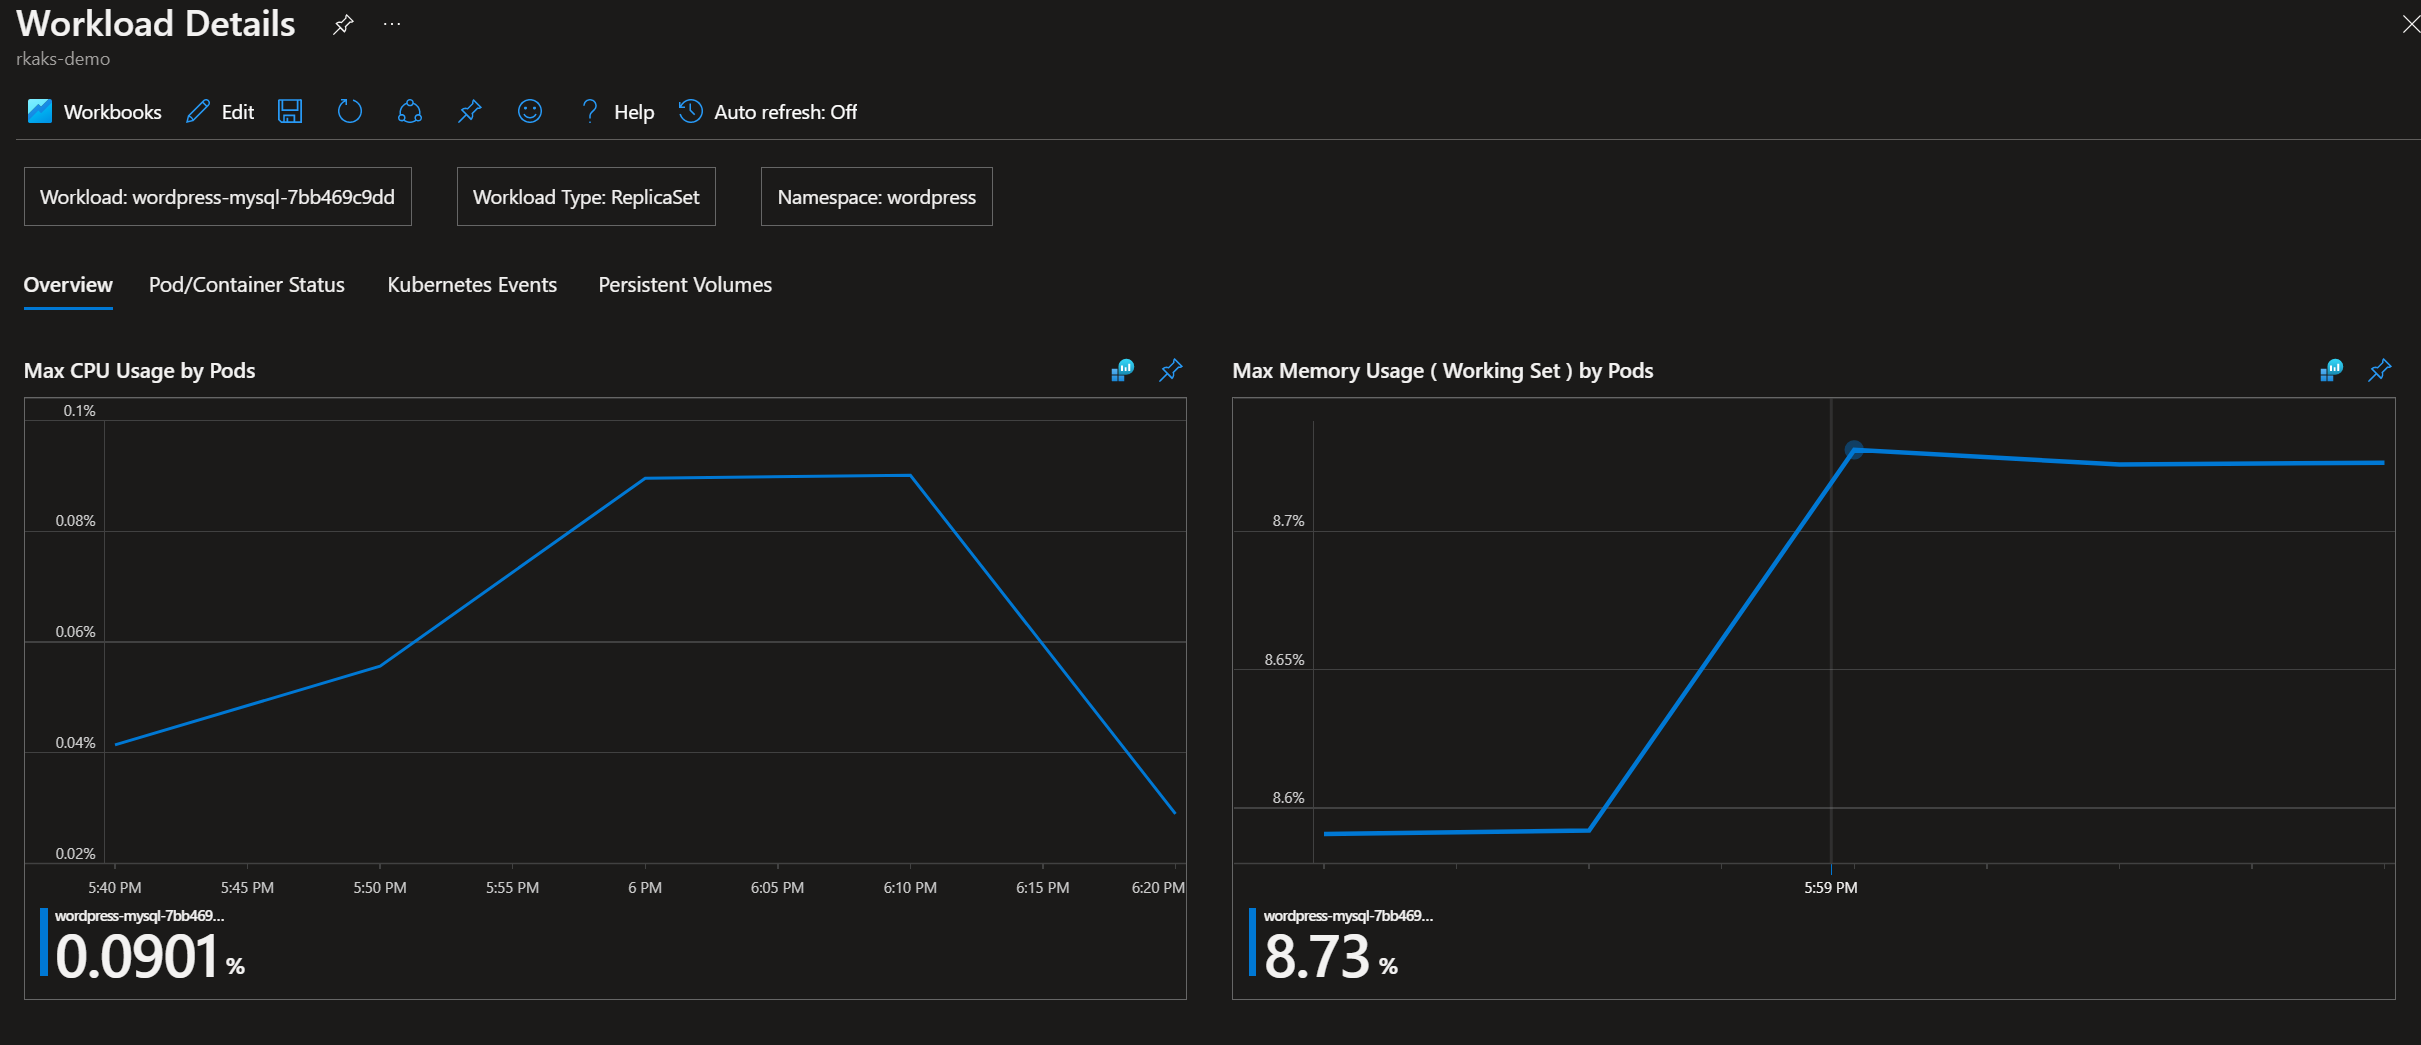
You can also click for Workbooks, and the workload details is one of the work books. I find this useful to see the an another view of CPU and memory usage at the Kubernetes deployment object level.
Hope this gives a good walkthrough and overview end to end of using JMeter in AKS and viewing the metrics with Azure Monitor for Containers. I have used this my work and production to help troubleshoot performance issues and optimize allocation of cpu and memory resources to Kubernetes deployments in the various applications. This granular level of resource optimization makes Kubernetes powerful to achieve a densely packed Kubernetes Cluster in optimization infrastructure costs.
