Azure Batch Parallel Task Execution
From the previous blog post of Part 4, I have shown a parallel execution of tasks of a .NET console application. In this blog post, I will show details and illustrations of the execution and monitoring features of Azure Batch.
Execution 1
The following are conditions, parameters and data setup for this is execution.
Test data: 54 data points to process.
Pool
- OS WIN2016
- VM Size standard A1 – 1vCPU 1.75GB RAM
- 20 dedicated nodes
- ~$92.28 CAD/month each
- 30 low priority nodes
- ~$29.86 CAD/month each
- Batch VM pricing https://azure.microsoft.com/en-us/pricing/details/batch/
- Task scheduling policy: Spread
- Max Tasks per node: 2

Job
- 54 Tasks – command line executions of my data collecting .NET console app with varying command arguments
The nodes with a darker shade are low priority VMs.

To see a monitoring dashboard, click on Overview blade

Scroll down to see Monitoring section. These are predefined metrics.

You may create your own chart, by clicking on the Metrics blade and select the Available metrics

The monitoring metrics are displayed as follows

At this time point in the chart, 54 task start events have occurred and as a result, 21 nodes are running most of those tasks. At the same 28 nodes are idle, and 1 node has suddenly become unusable. Probably an issue with node deployment or server failure. This is okay since Azure Batch wouldn’t schedule a task.

Shortly after, we see the max utilization of nodes at 28 running out of the 50 nodes initially provisioned. As time proceeds, we can see less nodes running and conversely, more nodes being idle as the running tasks finish their individual executions of the .NET console app.
Total execution time: ~ 26 mins
In my console app, I implemented logging and tracing with Application Insights SDK to send the telemetry to my App Insights service. By clicking into the Metrics Explorer blade, I can see the traces, exceptions and any other metrics.

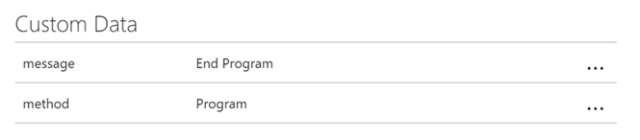
I can further drill into my trace logging and see my custom message. This is my last trace message noting the end of the execution.
I couldn’t find any monitoring in terms of CPU, memory and I/O for each node. Something that would be very useful for performance tuning.
In conclusion, I have shown monitoring and some its metrics for Azure Batch and the .NET console application using Application Insights.

Pingback: Azure Batch for Internet Data Collection Part 4: Parallel Task Execution – Roy Kim on Azure, SharePoint, BI, Office 365